New Indicator: “VSA on the FLY”
 The “VSA on the FLY” indicator is designed to quickly display various Market Profile parameters. The indicator takes the initial data for operation from the M1 timeframe. The indicator is installed on any timeframe. Developed for Metatrader 4, 5
Main input parameters:
- Show VWAP. Show VWAP line. The default is true.
- Show StdDev Bands. Display three groups of standard deviation for VWAP. The default is false.
- View Stdev as Channell. Display standard deviation groups with filled areas. Attention! This option is available only in MetaTrader 5. By default false.
- StdDevs Period. Average period for standard deviation calculations. The default is 8.
- Deviation Band 1, 2, 3. Standard deviation group factors. The default is 1, 2, 2.5.
- Deviation Band 1, 2, 3 Color. Colors of three groups of standard deviation.
- Show MEDIAN. Display MEDIAN value. The default is false.
- Show POC. Display POC. The default is false.
- Show Diagramm.Display a horizontal volume diagram. The default is false.
- Volume Type. Source type. Available:
- TICK. Tick volumes are used. This is the default.
- REAL. Real volumes are used.
- View Type. Diagram display type. Available:
- NORMAL. Regular horizontal diagram. This is the default.
- BUYSELL. Diagram with a breakdown into “volumes of buyers” and “volumes of sellers”.
- DELTA. Delta is the difference between the “volumes of buyers and sellers”.
- Horizontal size. The horizontal size of the diagram. The maximum diagram line length is this number of candles, starting from the initial position. The default is 10.
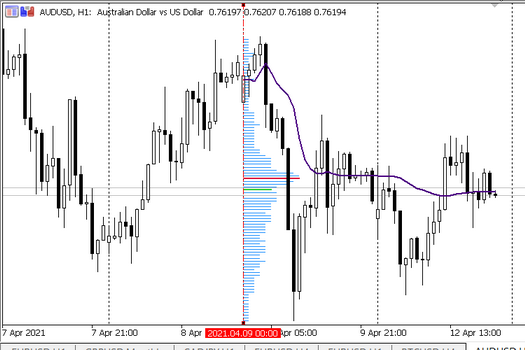
After installing the indicator on the chart and setting the parameters, the user receives a screen with a vertical line on the last bar:
 The user selects a vertical line and moves it to the desired position. From this moment on, the vertical line becomes the left border of the indicator, its starting point. All indicator data is displayed from this border.
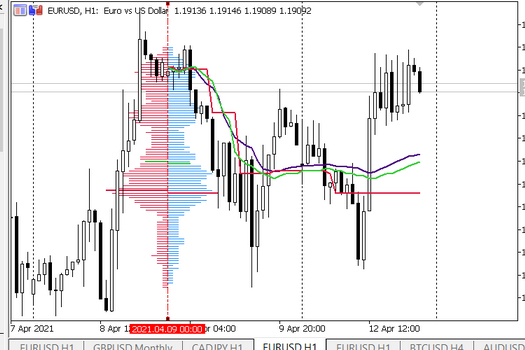
Turn on the display of POC, VWAP and MEDIAN:

We turn on the horizontal volume diagram. In this case, it shows the distribution of the tick volume from the left border (vertical line) to the current time value. As new data arrives from the M1 timeframe, the diagram will be rebuilt:
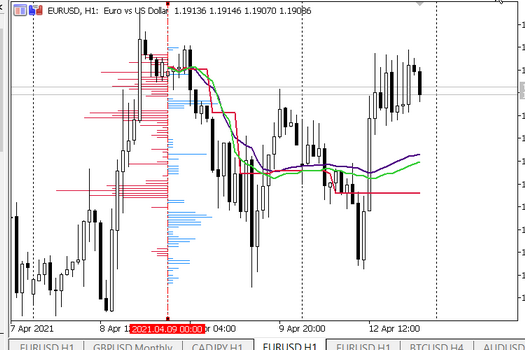
 There are three types of diagrams that you can build. The first diagram is shown above, the second is the horizontal volume divided into “seller volume” and “buyer volume”, and the third is a delta diagram:
 |
 |
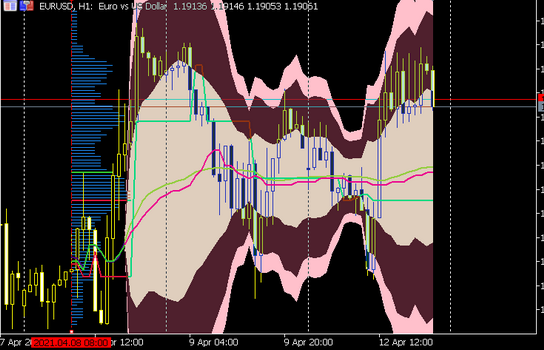
Three standard deviation groups can be shown for VWAP values. The user can turn the display on and off, change the multipliers of the groups. In addition, MetaTrader 5 has the ability to display standard deviation groups as channels:
 |
 |
The attached archive contains a more complete description in Russian and English.

2 Comments
Здраствуйте! Очень хотелось бы иметь индикатор VSA on the FLY и посмотреть как он работает.
Здравствуйте. Возникла необходимость пофиксить один досадный баг. Как только я его устраню, то тут же свяжусь с вами.