New Indicator: VSAMultiAnalize for Volume Spread Analysis
 The VSAMultiAnalize indicator serves to construct a horizontal volume profile and delta on the symbol graph (VSA – Volume spread analysis). Construction can be performed in
various ways.
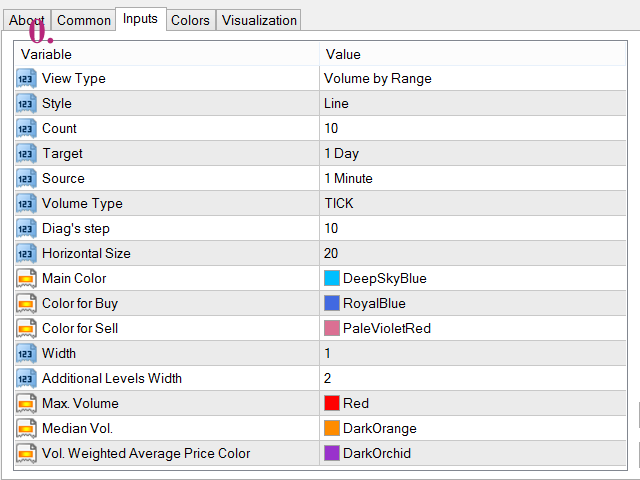
Input parameters:
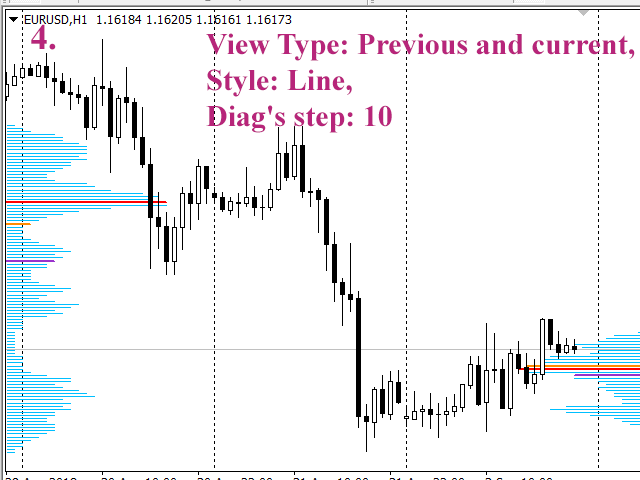
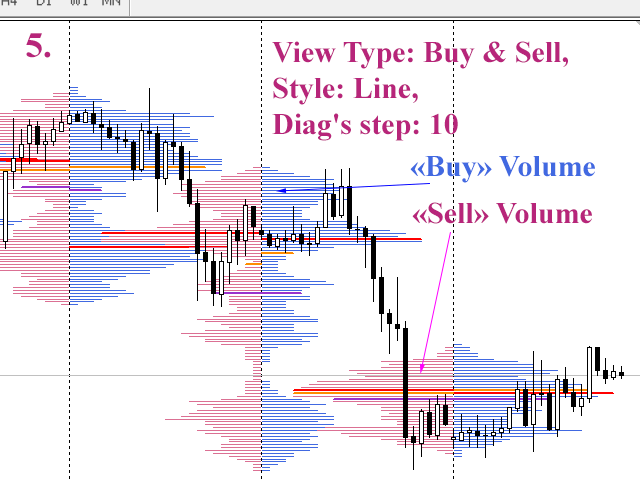
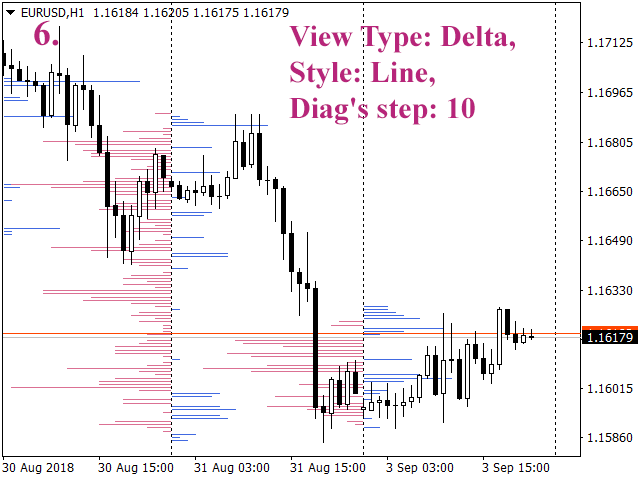
- View Type. What is displayed on the chart.
- Volume by Range. The horizontal volume profile for the specified timeframe is the Target parameter.
- Previous and current. Two horizontal volume profiles for the current and past period (for example for the current and last day).
- Buy & Sell. Separate profiles of horizontal volumes for buying and selling.
- Delta. Diagram of the Delta.
- Style. The style of the diagram.
- Line. Horizontal lines (default).
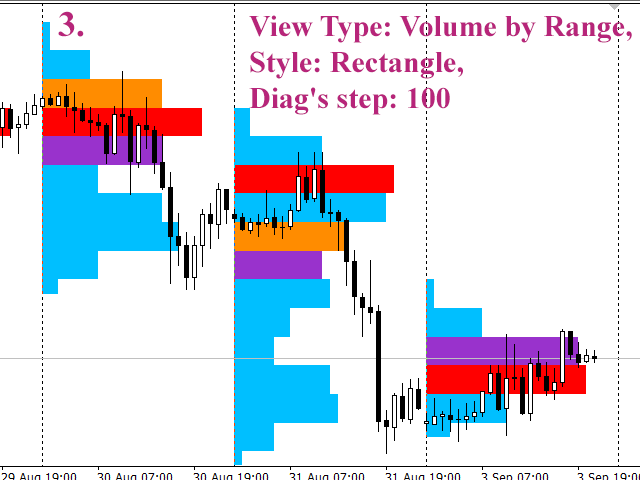
- Rectangle. Rectangles.
- Count. The initial number of diagrams on the graph (default 10).
- Target. Diagrams are built for this timeframe (the default is D1).
- Source. Data source for plotting charts (by default this is M1).
- Volume Type. Tick or real volume values are used (default is tick).
- Diag’s step. Attention! Only for experts. Averaging parameter of the diagram data.
- Horizontal Size. Attention! Only for experts. The maximum size of the diagrams horizontally.
- Main Color, Color for Buy, Color for Sell. Main colors of diagrams.
- Width. The thickness of the diagram lines (default 1).
- Additional Levels Width. The thickness of lines of additional levels (the default is 2).
- Max. Volume. The color of the maximum volume level.
- Median Vol. The color of the level of the median volume (half of the total).
- Vol. Weighted Average Price Color. Color VWAP level.
The video and screenshots show the constructions with the following parameters:
- Target = D1
- Source = M1
Buildings are performed on the timeframe H1. Horizontal profiles of
daily volume are shown, current and last day volume profiles, daily
volume profiles, split into two parts – for buy and sale, delta
profiles. In all cases, the timeframe M1 was used for the source data.
daily volume are shown, current and last day volume profiles, daily
volume profiles, split into two parts – for buy and sale, delta
profiles. In all cases, the timeframe M1 was used for the source data.
 |
 |
 |
 |
 |
 |
 |
Interesting? E-mail here:
