Big Update: VSAMultiAnalize for Volume Spread Analysis
 The VSAMultiAnalize indicator serves to construct a horizontal volume profile and delta on the symbol graph (VSA – Volume spread analysis). PDF file with a description of the indicator is available here.
- Internal bugs fixed.
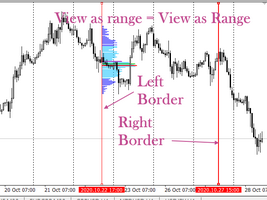
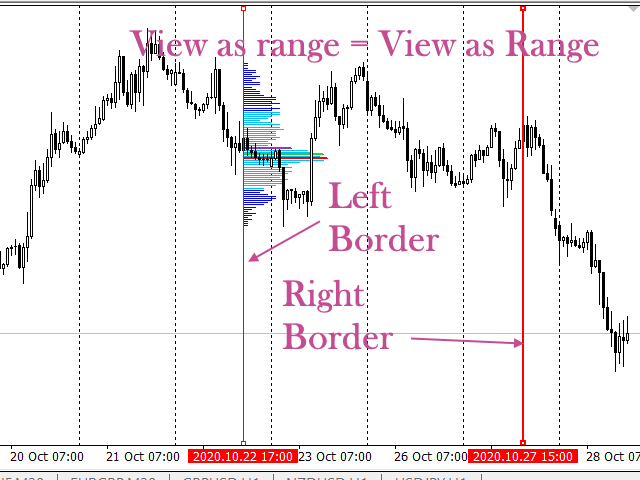
- Added “View as range” display mode. The volume profile is drawn between two vertical lines. They mark the beginning and end of the construction time interval. Example in the screenshot:
- New video – tutorial:
Interesting? E-mail here:
